 Entry
Entry Dashboard
 Contacts
 Properties
 Email
Email Calendar
 Tasks
Tasks Acquisition Cockpit
 Audit-proof mail archiving
 Automatic brochure dispatch
 Billing
 Groups
 Intranet
 Marketing Box
 Multi Property module
 Multilingual Module
 onOffice sync
 Presentation PDFs
 Process manager
 Project Management
 Property value analyses
 Enquiry Manager
 Showcase TV
 Smart site 2.0
 Statistic Tab
 Statistics toolbox
 Success Cockpit
 Time Tracking
 Address from clipboard
 Text block
 Customer communication
 External Tools
 Favorite links
 Calculating with formulas
 Mass update
 onOffice-MLS
 Portals
 Property import
 Quick Access
 Settings
 Templates
 Step by step
You are here: Home / Additional modules / Statistics toolkit / Elements in the statistics toolbox
€
Statistics toolkit
Elements in the statistics toolbox
The description here is based on the version of the statistics toolkit with its own module icon. This differs only in the position of the filter bar (here above the tabs instead of in the tabs) and the icons for the tabular and graphical display at the top right.
As in the dashboard, there are tabs and widgets here, but there are also other elements in the statistics construction kit. The following picture gives an overview. The individual elements are briefly explained below. Detailed descriptions of the elements and the configuration can be found on the following pages.
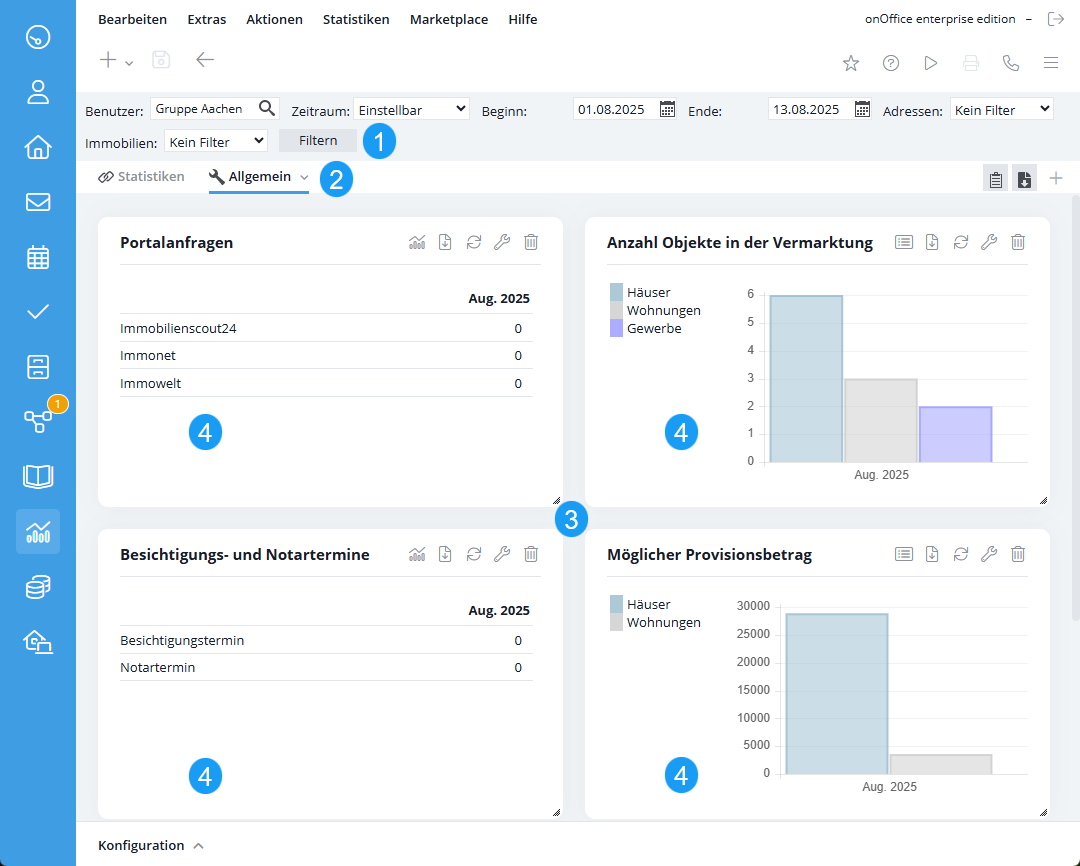
- Filter bar: Here you can specify the scope of the data records to be analyzed. The settings you make here apply to all tabs and statistics. Which statistics would change if you changed something in the filter bar? To see this more quickly, you can place the mouse over the default field and hold it there for a moment. All statistics that are not affected are then grayed out. Only the statistics that are changed by the filter are still active and all settings are applied by clicking on “Filter”. The filter bar always applies to all tabs, whether in the statistics board or in a statistics tab in the dashboard.
- Tableiste: Here you can create several tabs to organize the statistics thematically. On the right-hand side is the symbol with which all statistics in the selected tab are displayed as a graphic or as a table . Next to it is the symbol for exporting the statistics . You can open the configuration of the active tab via the drop-down menu for editing behind the menu triangle on the right-hand side of the tab. By clicking on the individual tabs again, you can update all the statistics in them at once.
- Statistics construction kit: The individual statistics are arranged as widgets within the tab. You can adjustthe size and position as in the dashboard, and the title of the statistic is displayed at the top of the respective statistics widget; this should be specified when creating the statistic so that you can later recognize directly what is actually being evaluated here. The symbols are arranged on the right-hand side: for configuring the statistics , the “Refresh” button , the button for exporting and for switching between tabular and graphical display / . The latter is used to change the view of the individual statistics; all existing statistics in a tab can be changed centrally using the view icon in the tab bar. You can update the content of an individual statistic using the “Refresh” icon in the widget frame. You can update all statistics on a tab by clicking on the tab itself, and the individual statistics widget can have its own user assignment , which is independent of the assignment in the filter bar.
- Statistics: The key figures are displayed graphically as a bar chart or table. If desired, the current “total annual value” can be displayed in the tables. The time sequence is displayed horizontally. The criteria are shown one below the other or next to each other in the graphical view. As soon as you position the mouse over the bar for a particular month in the graphical view, the exact figures for all criteria for that month are displayed. For address or property statistics, clicking on a key figure in the table usually opens a search result pop-upin which the counted data records are displayed.