 Entry
Entry Dashboard
 Contacts
 Properties
 Email
Email Calendar
 Tasks
Tasks Acquisition Cockpit
 Audit-proof mail archiving
 Automatic brochure dispatch
 Billing
 Groups
 Intranet
 Marketing Box
 Multi Property module
 Multilingual Module
 onOffice sync
 Presentation PDFs
 Process manager
 Project Management
 Property value analyses
 Enquiry Manager
 Showcase TV
 Smart site 2.0
 Statistic Tab
 Statistics toolbox
 Success Cockpit
 Time Tracking
 Address from clipboard
 Text block
 Customer communication
 External Tools
 Favorite links
 Calculating with formulas
 Mass update
 onOffice-MLS
 Portals
 Property import
 Quick Access
 Settings
 Templates
 Step by step
You are here: Home / Additional modules / Statistics toolkit / Use statistics / Create statistics

Statistics toolkit
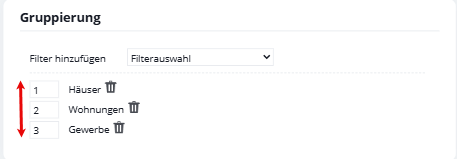
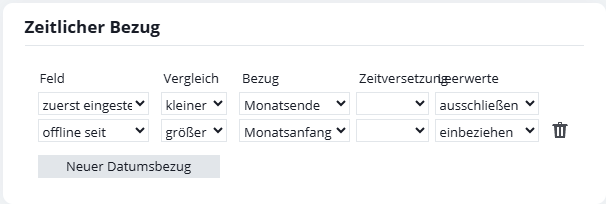
Create statistics
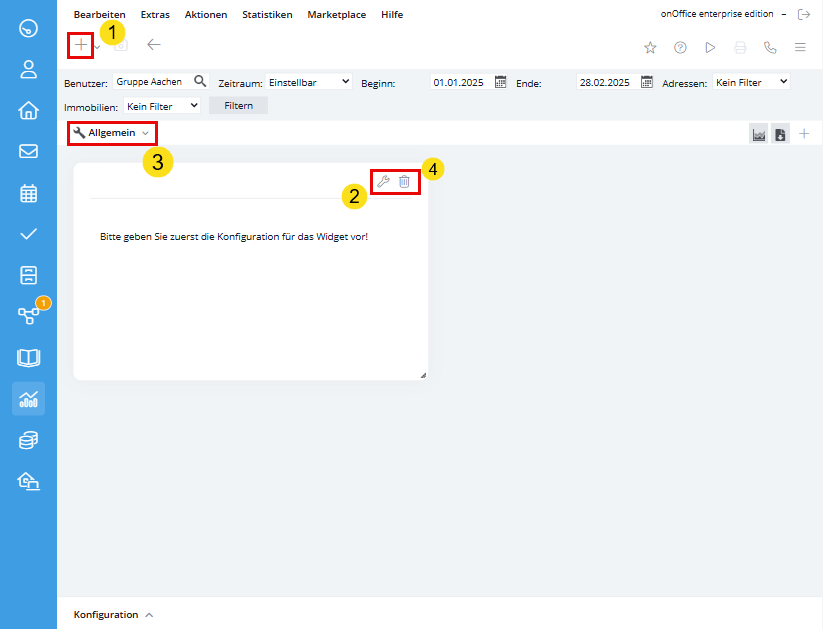


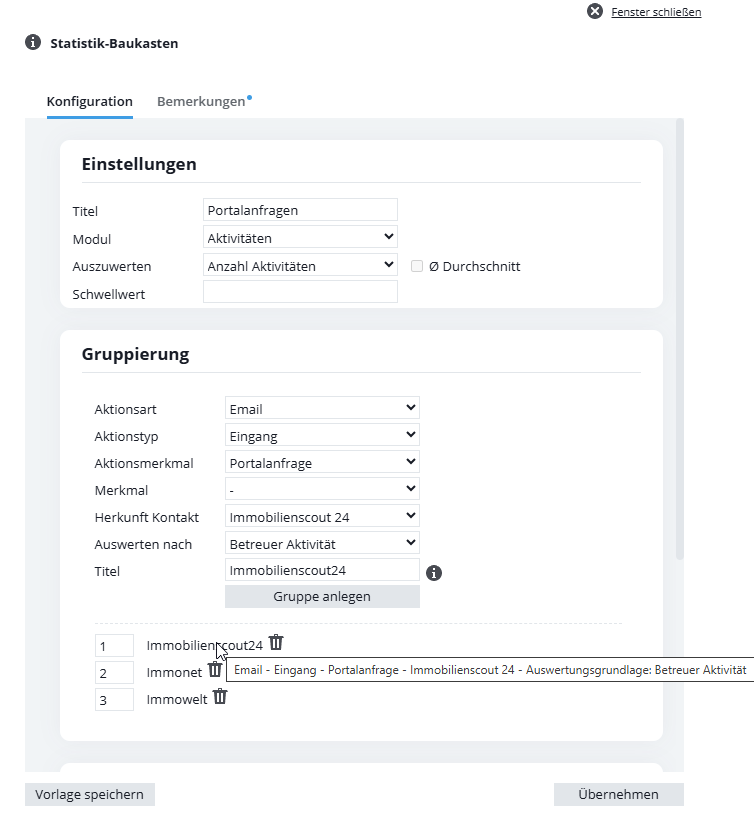


Statistics toolkit