

You are here: Home / Additional modules / Property / Contact statistics / Manage property / contact statistics / Statistics: What numbers? How do I report this?
€

Property / Contact statistics
Statistics: What numbers? How do I report this?
How to create, move or resize widgets in general is described in “Tabs and tab contents“.
Here you can learn how to configure the statistics. You can use an existing template as an example, modify it, and save it as your own template, or start with a “blank” template.
The sample templates include an information
with a brief explanation of the statistics.
There are two types of statistics: First, we analyze activity statistics (which are based on the entries in the agent’s log / activities). We will examine these in more detail below. Second, there is the “Assigned Items Overview,” which is displayed only in tabular form. Their configuration is simpler and will be explained only briefly here.
Open configuration
The configuration dialog for a statistics widget is opened by clicking the Edit icon
in the widget frame. You must be an administrator to perform the configuration. You can read here about how to set up the configurations and what options are available there.
Statistics
Statistics can be displayed as a graph (bar chart, pie chart, line graph) or as a table. No matter which template or configuration you choose, the system will either count the number of entries or calculate the total cost. This value is then displayed for the selected properties. The key point is which properties are considered and how they are counted. This is explained here using examples; you can find a list of all configuration options here.
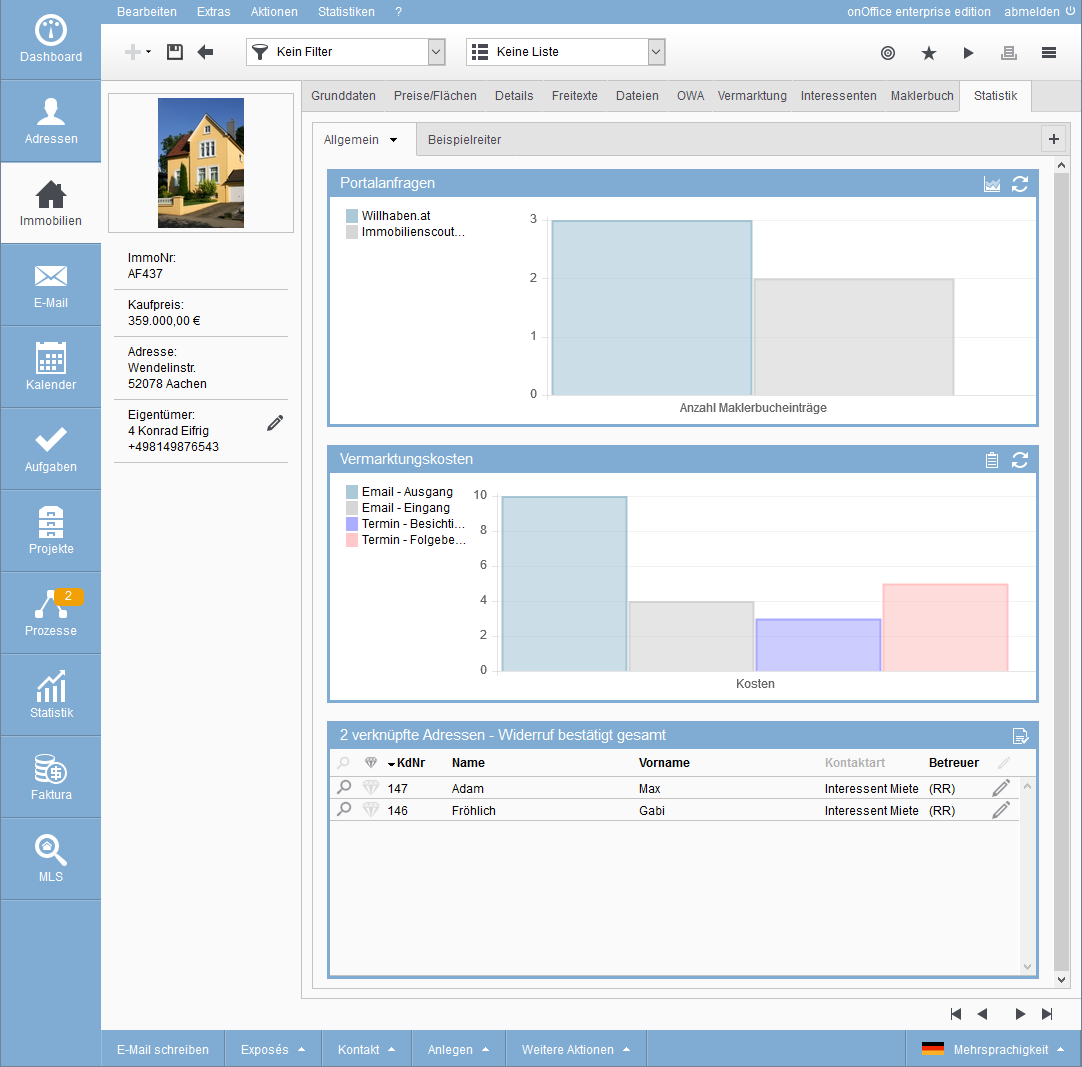
Example: Portal Requests—What Is Counted and How?
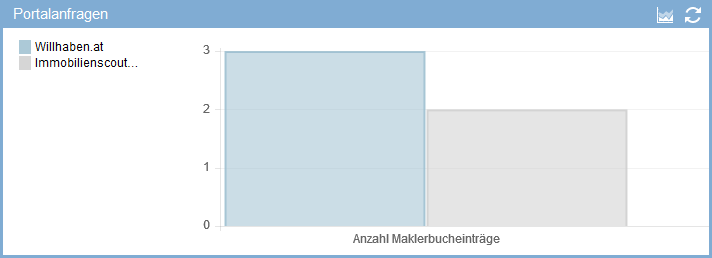
Using the example of “portal requests,” the text explains “what” and “how” is counted. This also determines what is displayed as X and what is displayed as Y in the graphical view.
The “Portal requests” widget is a property statistic presented as a bar chart. It answers the question, “How many requests about this property came from which portal?”
To do this, a bar is displayed for each portal from which a request originated. The amount corresponds to the number of requests.
What is counted: In this example, “Contact origin” was selected as the criterion.
In the “Settings” section of the configuration dialog, you specify the criterion to be used for evaluation. Here, you can select the information from the “Activities” category in the agent’s log entries. The criterion also specifies whether the data is grouped or broken down by type of action or kind of action.
How is the count done: In this example, specific types of actions (email) and kinds of actions (inbox) as well as an action characteristic (portal request) are selected. The “Filter” section of the configuration dialog is used to specify which properties are displayed side by side.
The most important point here is the activity filter, which is located behind the “Action Type” field. Clicking the pencil icon opens the list showing the activity tree. Only the existing types of action are listed first. The list can be extended by clicking the plus symbol in front of the species. You can also use it to display the kinds of action of this type of action.
You can use the additional filter options (characteristic, time period) to refine the statistics and highlight specific aspects. The configuration in the example excludes emails from other portals that do not have an entry under “Contact origin” from the count. Emails you send to other portals that have an entry under “Contact origin” are also not counted.
Issue: What is displayed? In the example, the statistics have been configured as a bar chart. For each portal where an “Email” entry has “Inbox” listed as the “Contact origin,” a bar is displayed.
NOTE:
- Only the values for which entries exist are displayed. The number of “bars” displayed is adjusted automatically.
- You can use the “Contacts” or “Properties” filter to further narrow down the agent’s log/activity entries you want to analyze.
- A mix of action types and kinds has been configured in the activity filter.
What is displayed?
The selection of this criterion determines whether the data is broken down by type of action or kind of action.
Example: Marketing Costs—Should They Be Counted or Totaled?
The “Marketing Costs” example explains how “Number of Entries” and “Costs” differ as evaluation types.
The “Marketing Costs” widget is also a bar chart. The costs for all activities are displayed here. For each action type that is listed as an entry and for which costs have been entered, another bar is added to the chart.
What settings are required for this?
In order to total the costs, the costs must be entered for each individual entry. You can set default costs for actions , or assign them manually to the entries. In the “Marketing Costs” example, the costs of specific activities are totaled and broken down by kind of action.
To do this, you must select “Which value is counted” > “Costs” as the criterion. Nothing is selected under “Filter,” so all entries with associated costs are included.
In addition to the “Costs” analysis type in the “Marketing Costs” example, there is also an analysis by number.
The count is broken down by the number of agent’s log entries (as in the example “portal requests”) and by the number of linked contacts (in the case of property statistics).
When counting the number of linked contacts, each contact is counted only once, regardless of how many entries are linked to that contact.
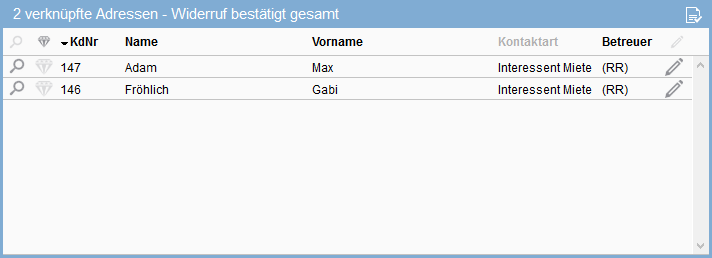
Example Revocation Confirmed (Total), Assigned Records Overview
The “Associated Records Overview” displays a list of contact records that are associated with this property—that is, records linked to the property through related activities.
In this example, a filter is used to narrow down the list to those who have confirmed their withdrawal.
The “Assigned Records Overview” not only analyzes contacts that are assigned to activities, but also analyzes prospects for a property (the “Prospects” tab, “Manually Assigned” sub-tab).
Notice:
Please keep in mind that the list can only display contacts or properties that you are authorized to view.
Examples of Reasons for Rejection
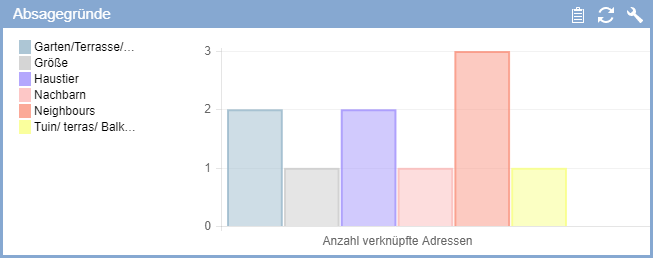
Under “Reasons for Rejection,” you will find a list of the reasons for rejection selected by the customer in the follow-up appointment . This illustrates the number of associated conmtacts based on the reason for rejection, as well as the frequency distribution of specific reasons for rejection. This widget can be displayed in both chart and table views. This allows you, for example, to assess which aspect of the property is hindering its marketing and, if necessary, take appropriate action.

Entry
Dashboard
Contacts
Properties
Email
Calendar
Tasks
Acquisition Cockpit
Audit-proof mail archiving
Automatic brochure dispatch
Billing
Groups
Intranet
Marketing Box
Multi Property module
Multilingual Module
onOffice sync
Presentation PDFs
Process manager
Project Management
Property value analyses
Enquiry Manager
Showcase TV
Smart site 2.0
Statistic Tab
Statistics toolbox
Success Cockpit
Time Tracking
Address from clipboard
Text block
Customer communication
External Tools
Favorite links
Calculating with formulas
Mass update
onOffice-MLS
Portals
Property import
Quick Access
Settings
Templates
Step by step